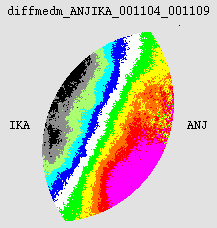
Median maps for radar pairs
ANJ-IKA
IKA-KUO
KOR-VAN
VAN-ANJ
KUO-UTA
UTA-LUO
STO-KOR
UTA-LUL
LEK-HUD
HUD-OSU
OSU-OVI
OVI-LUL
STO-LEK
LEK-OSL
OSL-HGB
The radar pair pictures give the median value of the difference in
reflectivities seen by the radars. The difference is shown on a colour
palette, where white shows points with reflectivities within 1 dB.
Each colours has a width of 3 dBZ. Occasionally the difference may exceed
15 dBZ (in absolute value). These are shown by the last colour in the palette.
The pictures gives us a way to decide whether the radars have a difference
in calibration. We can also find out what is the difference in the lowest
elevation angles. I proper determination of these is only possible by
numerical means, but a look by naked eye is able to reveal qualitative
information on the calibration and angle differences.
 The Anjalankoski-Ikaalinen pair (left) from
October is a simple case. As ANJ is the first radar in the pair, the
positive values of the difference denote that Anjalankoski radar sees a
stonger signal at that point. These are towards the south-east, i.e.
towards the Anjalankoski radar. The zero difference line goes parallel to
the bisector of the plot indicating that the lowest elevation of the radars
are the same. However, the bisector lies where the white and green colours
meet, indicating that the difference is slightly positive, 1
... 2 dBZ. Hence we may conclude that the ANJ radar measured slightly
higher reflectivities.
You will find pictures with highly variable features in the radar pair
directories. Once the analysis software is running, we can attach an
estimate of the angle difference and of the calibration difference to each
of the pictures.
A report by Robin King explains how
one can analyze the pictures visually as well as numerically.

 The Anjalankoski-Ikaalinen pair (left) from
October is a simple case. As ANJ is the first radar in the pair, the
positive values of the difference denote that Anjalankoski radar sees a
stonger signal at that point. These are towards the south-east, i.e.
towards the Anjalankoski radar. The zero difference line goes parallel to
the bisector of the plot indicating that the lowest elevation of the radars
are the same. However, the bisector lies where the white and green colours
meet, indicating that the difference is slightly positive, 1
... 2 dBZ. Hence we may conclude that the ANJ radar measured slightly
higher reflectivities.
